
Noel Hidalgo from BetaNYC at the kickoff to the TreesCount! Data Jam on June 4, 2016 – part of the National Day of Civic Hacking
National Day of Civic Hacking and BetaNYC
Last Saturday, June 4, 2016 was the National Day of Civic Hacking across the USA, where people from a variety of backgrounds come together to hack on projects for good. How cool is that!? It sponsored by Code for America and a bunch of other organizations and federal agencies. It’s a hackathon where people use government data available to them to work on different challenges. This year there were challenges with everything from mapping honey bees in your yard to analyzing data about the spread of Zika.
I am very interested in the intersection of technology and civic engagement, so when I discovered that BetaNYC was a civic group already doing this work in NYC I joined their Meetup Group immediately. The TreesCount! Data Jam was the first event I participated in, and I look forward to going to more!
TreesCount! Data Jam
BetaNYC partnered with the NYC Parks department to create the TreesCount! Data Jam Event on the National Day of Civic Hacking. They unveiled the TreesCount! 2015 dataset of all the street trees counted within the five boroughs of NYC, and people participated in hacking on 5 specific challenges you can read about here. Data was also collected on street trees in 1995 and 2005, though the 2015 data had more specific geospatial data because volunteers used TreeKits to map. Every time they’ve done the count they’ve realized that there are more and more trees on NYC streets!
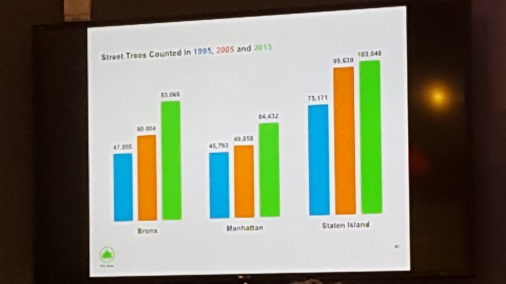
Bar graph from the Parks Department comparing the number of trees per selected boroughs in 1995, 2005, and 2015.
At the event kickoff, members of the parks department intro duced the new dataset and gave us information about how to access it in the NYC Open Data Portal. In fact, there were NYC Parks department employees hanging around all day to answer questions and provide a deeper understanding of how the Parks Department works. Manhattan Borough President Gail Brewer also gave a lighthearted speech about the importance of trees in NYC, as well as the complaints her office gets from constituents about trees, and now ivy around the trees leads to rats.
Off to work!
There was over 150 people there from all walks of life. I met UX designers, project managers, developers like me, data scientists, economists, and even volunteers who collected the data and wanted to see how people could use it. After the kickoff, people drifted towards the challenges they were interested in and began to look at the data and hack the day away!
I chose to participate in a workshop that was going on with Julia Marden from BetaNYC and Annarita Macri from the Parks Department. It was amazing! We learned how to interact with the NYC Open Data portal, took a deep dive into the NYC Trees and NYC Blockfaces (shows the completion of trees counted on a block level) datasets, made pivot tables, learned about Geocoding, and also worked on mapping the tree data using CartoDB. Next week I’ll be blogging about the map I made of edible tree species in the NYC urban forest landscape!
End of Day

You can see the four teams at their numbered laptops ready to present. The current team was presenting on their data that mapped trees in bad condition in proximity to places like daycares and senior citizen centers.
I have to say that this was one of the most well-run events I have ever attended. An example of the event’s efficiency has to be the end-of-day wrap-up where about 20 teams who did the hackathon each at a 2 minute (or was it one minute?) period of time to present their project to everyone. Each project was based on one of the five challenges presented at kick off, and they were judged by a panel of experts on how well they completed the challenge. After each presentation, the next team was already on stage ready to hook into the overhead screens and present. The presentations and projects turned out great!
One standout for me was a Twitter robot called Every Tree NYC (@everytreenyc) that interacts with the Tree Data to answer the challenge of increasing public engagement with the tree data. Basically, it pairs pithy (pith – HA!) statements with images and locations of trees around the five boroughs. For instance, an image of a dead tree came with the caption, “RIP.” Other projects were more serious in tone than this one, but my love of a good pun is making a little biased here!
Get back to your roots. Visit me. – Callery Pear, Ridgewood pic.twitter.com/ah9JDwK6vR
— Every StreetTree NYC (@everytreenyc)
June 4, 2016
The projects were extremely inspiring. It was amazing to see what people can create when given data and a few hours to hack on it! I highly suggest this event, and I know I will surely be participating next year.

My neighborhood pizza parlor also made an appearance in this project that compared weather station data on streets with trees versus without streets!
Civic Hall and Future Events
Also, did I mention that the event took place at Civic Hall – an amazing community center! You should definitely check it out! If you want to become a member you do have to pay a monthly fee, but they host a lot of interesting events. For instance, next Tuesday, June 7th at 12:30 they hosting an event where they are launching the 311 Call Center Inquiry dataset.

Pingback: “Edible” Tree Species Mapped in NYC | Aimee's Coding Blog